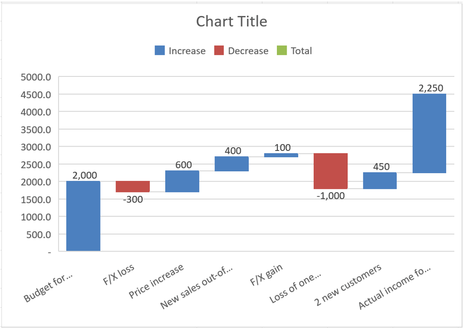
What is the Waterfall Chart
A Waterfall chart, also known as a ‘Bridge chart’ (name mostly used in Finance), ‘Flying Bricks chart’ or a ‘McKinsey chart’, is an easy and simple data visualization that helps to identify and understand how an initial value is affected by increase and decrease of intermediate items, leading to a final value.
When to use Waterfall Charts
Waterfall charts are mostly used in business and finance analysis for:
- Performance analysis (profit-and-loss, cash-flow, inventory or sales analysis) by showing how a value changes through a series of contributions
- Forecasting future influences based on present impact of the intermediary items
- Predicting future trends based on the variance between past periods
- Budget versus actuals comparisons
How to create a Waterfall Chart
Let us take an example of budget vs actual comparison and walk through how to create a Waterfall chart. Start by entering Waterfall data in Excel.
2. Select the data and click Insert > Charts and choose Waterfall
3. Double click on the last data point (the one you want it as total or subtotal) to open Format Data Point and check Set as total box to make the column not float
4. To make your chart presentable:
This is the result where you can see the intermediary elements that have not been considered in the budget and landed the final month income higher than expected
- Rename the chart title
- Delete the legend
- Format the vertical axis
- Color columns with negative numbers in red and positive numbers in green by double clicking on each data point (Fill and Border under Format Data Series>Series Options)
- Keep the budget and actual non-floating columns in blue
- Change the Gap Width under Format Data Series>Series Options to 0%
This is the result where you can see the intermediary elements that have not been considered in the budget and landed the final month income higher than expected
You don't have Excel 2016 yet? No worries! Download a waterfall chart template for Excel 2007-2013
Guest article by Aurora Villumsen: Qualified and experienced business analyst with experience in financial management and investment, software and SaaS industry. Exquisite financial modelling skills and analysis abilities, able to make sense of unorganized data and formulate recommendations from complex or vague data.


