


Last week I had the pleasure and privilege of being able to attend the ModelOff Global Training Camp 2018 held in London at the Southbank University. The training offered an interesting mix of financial modelling and advanced Excel techniques. Although Microsoft, naturally, was the major player in terms of vendor offering, a number of other vendors were present as sponsors. That included ClusterSeven with its spreadsheet testing expertise, Epsillon (formatting of Office documents for publication), Excel4Apps (spreadsheet management and risk reduction). There was also presentation from Quantrix, who offer a software system goes beyond the bounds of Excel in terms of multidimensional modelling. On the finance side, the major sponsors were PwC and Ansarada.
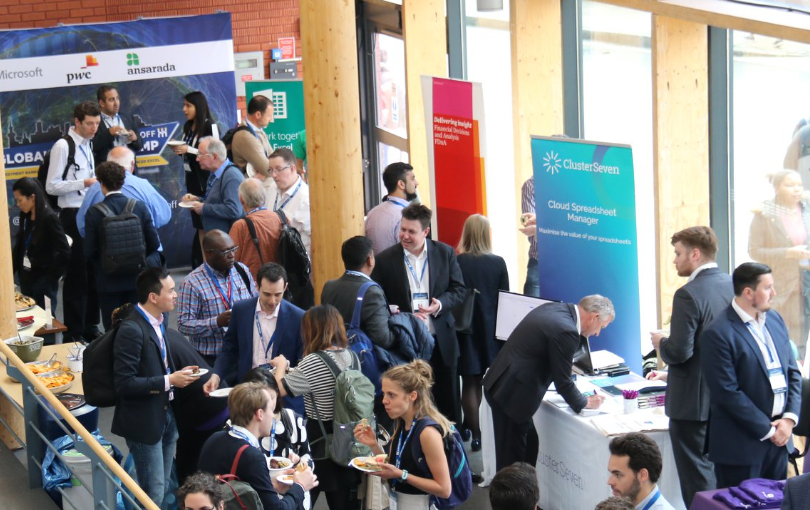
Gathering in the foyer
One of the attractions of the event was the depth of expertise available both in the context of presentations and within the more general discussion. As far as Excel was concerned, the years of experience one could tap in the form of past and present MVPs was immense and that was complemented the somewhat younger Microsoft staff that ran through new and future offerings. For me, it was a particular pleasure to meet up with Charles Williams, Roger Govier and Bob Phillips once more.
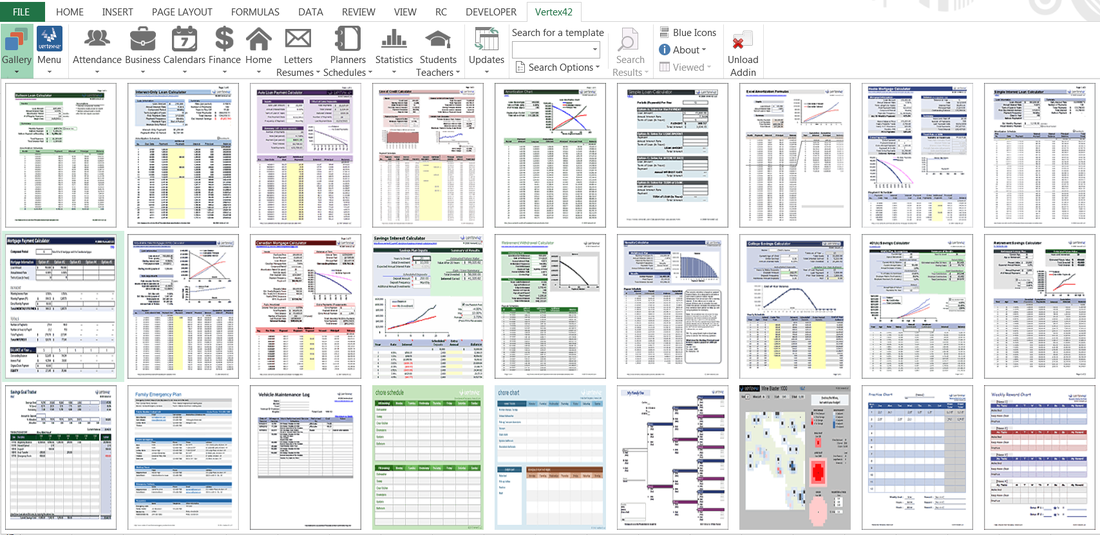
The program organisers had put on an interesting and varied program. With my background in aeronautics research, perhaps one should not be surprised that I focussed mainly upon the Excel sessions. That said, I did attend a presentation on ‘Driver based Forecasting in Excel’. The presenter Clair Delicata showed a number of techniques for the aggregation of data across sheets using 3D ranges and the use of array formulas to bring whole regions of a user-select worksheet to be replicated in a dynamic summary sheet for review. Something that was particularly refreshing for me was the attention Clair pays to the presentation of results to clients, even going to the length of complying with client brand palettes and guidelines. (I have included a photo, below, to show that I was there and appear to be enjoying the presentation!)
The program organisers had put on an interesting and varied program. With my background in aeronautics research, perhaps one should not be surprised that I focussed mainly upon the Excel sessions. That said, I did attend a presentation on ‘Driver based Forecasting in Excel’. The presenter Clair Delicata showed a number of techniques for the aggregation of data across sheets using 3D ranges and the use of array formulas to bring whole regions of a user-select worksheet to be replicated in a dynamic summary sheet for review. Something that was particularly refreshing for me was the attention Clair pays to the presentation of results to clients, even going to the length of complying with client brand palettes and guidelines. (I have included a photo, below, to show that I was there and appear to be enjoying the presentation!)

Peter attending a finance modelling presentation!
In addition I attended a presentation by John Tennent on the use of Monte Carlo simulation in financial modelling. This demonstrated the impact variability can have on one’s decision making and showed how VBA could be used to gather information from a dynamic model. I also failed utterly to read a Tornado diagram. I had always assumed that the long bars were important in terms of sensitivity. It seems that exactly the opposite is true; the bars showed how for the parameter has to move to create a given change in the output so the smaller the bar the more important the parameter!
A ‘must attend’ for me was the ‘Deep Dive into Get & Transform Data in Excel’ given by Guy Hunkin from the Microsoft Excel Team. As a researcher, I have never had to import and process vast tranches of corporate data and, as a result, had regarded the new Power tools as interesting but not really aimed at my usage. Increasingly, though, I have found use for these tools, which will aggregate data from multiple workbooks, then combine and structure it. As always, being self-taught, through a process of trial and error, brings with it risk and a sense of uncertainty. It was reassuring to that, in the broad, my understanding of the functionality and use of initially very unfamiliar techniques was correct.
Altogether, a worthwhile experience.
Peter Bartholomew


 RSS Feed
